IELTS Writing Task 1: примеры ответов с разбором (line graph, pie chart, process)
Обновлено
Ниже три образца на самые частые типы заданий Task 1 Academic. Все задания и данные составлены для этой статьи. Обращайте внимание не на отдельные слова, а на то, как построены overview и абзацы деталей. Общие правила Task 1 — в статье «Writing Task 1 Academic».
Пример 1. Линейный график
Задание. The line graph shows the average number of hours per week that teenagers in one country spent on three leisure activities between 2000 and 2020.
Данные: просмотр ТВ 18 → 15 → 9 ч; онлайн-игры 3 → 8 → 12 ч; спорт 6 → 6 → 5 ч (2000, 2010, 2020).
Ответ (около 175 слов):
The line graph illustrates how much time teenagers in one country devoted each week to watching television, playing online games and doing sport over a twenty-year period from 2000.
Overall, television viewing fell steadily while online gaming rose sharply, and by the end of the period gaming had become the most time-consuming activity. Time spent on sport, by contrast, hardly changed.
In 2000, television was by far the most popular pastime, with teenagers watching an average of 18 hours a week, three times as long as they spent on sport (6 hours) and six times as long as on online games (3 hours). Over the following decade, viewing dropped slightly to 15 hours, whereas gaming more than doubled to 8 hours.
Between 2010 and 2020 these trends accelerated. Television time fell to just 9 hours, and online gaming continued to climb, reaching 12 hours and overtaking television at some point in the second half of the decade. Sport remained the most stable activity throughout, dipping only marginally to 5 hours in 2020.
Разбор: overview называет три тренда и главный итог (игры стали лидером) без цифр; детали разбиты по периодам; точные сравнения (three times as long, more than doubled, overtaking); нет причин и мнений.
Пример 2. Круговые диаграммы
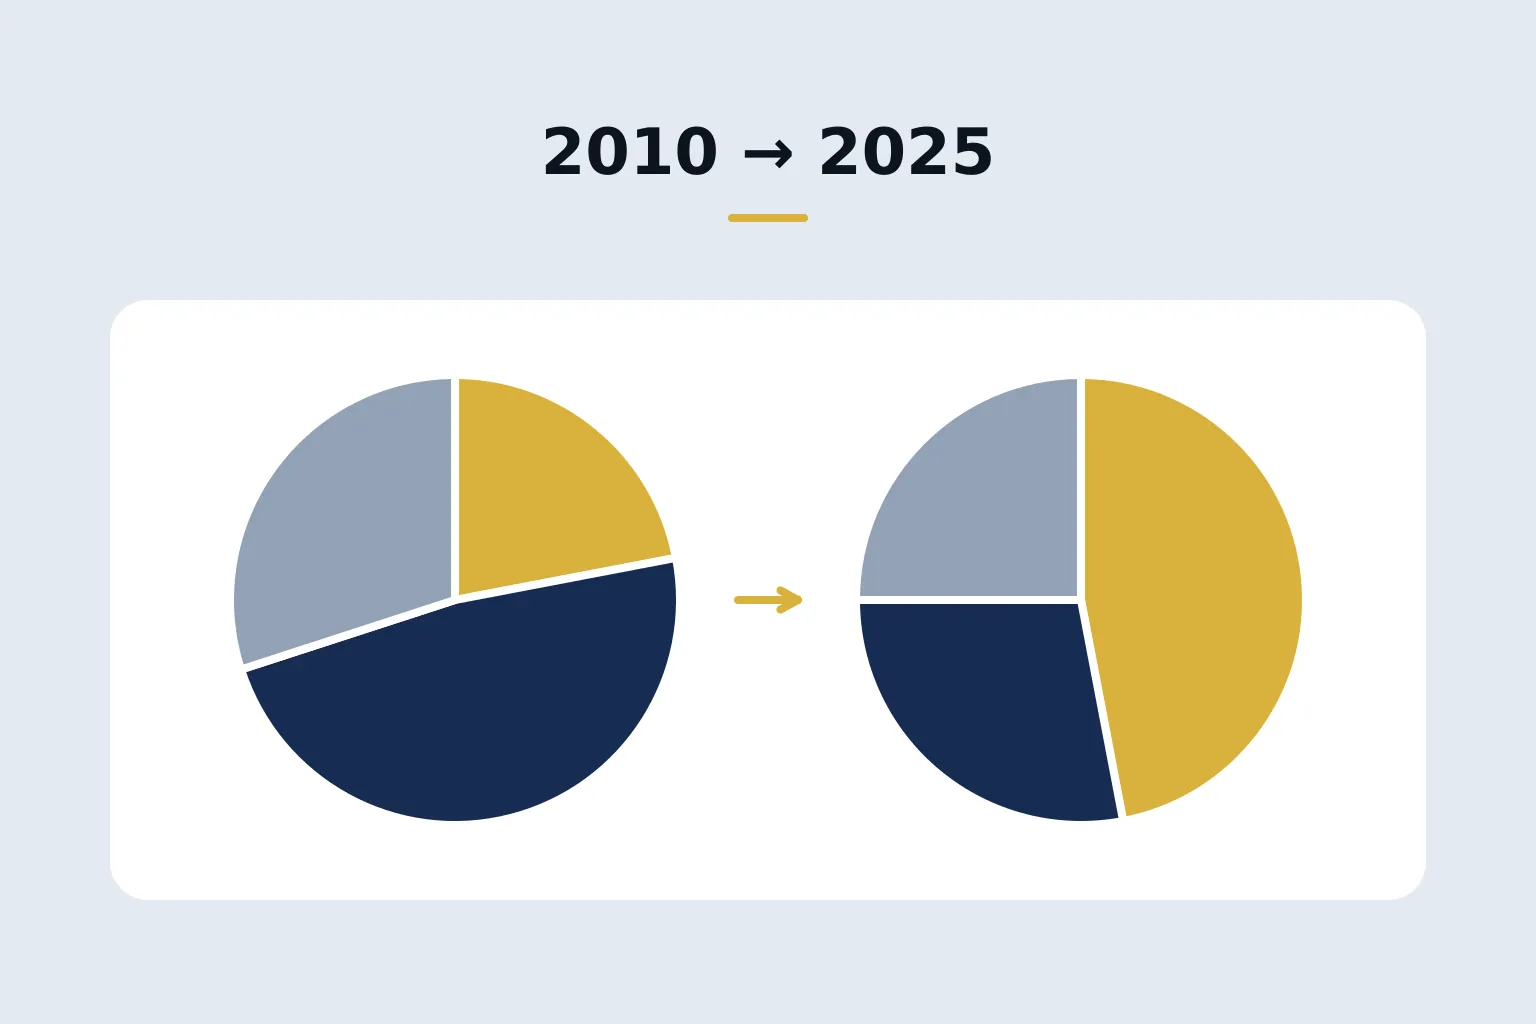
Задание. The pie charts compare the sources of electricity in one country in 2010 and 2025.
Данные: 2010 — уголь 45%, газ 30%, атом 15%, ВИЭ 10%; 2025 — уголь 15%, газ 30%, атом 20%, ВИЭ 35%.
Ответ (около 170 слов):
The two pie charts show the proportion of electricity generated from four different sources in a particular country in 2010 and 2025.
Overall, the country's energy mix shifted markedly away from coal and towards renewables, which became the largest single source by 2025. The share of gas, meanwhile, stayed exactly the same.
In 2010, coal was the dominant source, accounting for almost half of all electricity (45%). Gas supplied just under a third (30%), while nuclear power and renewable sources made up much smaller shares, at 15% and 10% respectively.
By 2025, the picture had changed considerably. The contribution of coal had fallen to only 15%, a third of its earlier level, whereas renewables had more than tripled their share to 35%, overtaking both coal and gas. Nuclear power also grew, though more modestly, rising by five percentage points to 20%. Gas continued to provide 30% of the country's electricity.
Разбор: для круговых диаграмм важен язык долей (almost half, just under a third, a third of its earlier level); изменение долей описано в percentage points; стабильный показатель (газ) упомянут в overview — это тоже ключевая особенность.
Пример 3. Процесс
Задание. The diagram shows how recycled glass bottles are processed.
Этапы: сбор → сортировка по цвету → мойка → дробление → плавление → формовка новых бутылок → доставка в магазины.
Ответ (около 165 слов):
The diagram outlines the stages involved in recycling used glass bottles and turning them into new ones.
Overall, it is a linear process consisting of seven stages, beginning with the collection of used bottles and ending with the delivery of new bottles to shops.
First, used bottles are gathered from collection points and transported to a recycling plant. There, they are sorted according to their colour, typically into clear, green and brown glass, since different colours cannot be mixed. Once sorted, the bottles are washed thoroughly to remove labels and any remaining contents.
At the next stage, the clean glass is crushed into small fragments, which are then melted down in a furnace at a very high temperature. The molten glass is poured into moulds and shaped into new bottles. Finally, after cooling, the finished bottles are packed and delivered to shops, where they can be filled and sold again.
Разбор: overview называет число этапов, начало и конец; пассив используется естественно (are gathered, is poured); разнообразные связки последовательности (first, there, once sorted, at the next stage, finally), а не одно then.
Как использовать примеры
- Возьмите задание, напишите свой ответ за 20 минут.
- Сравните с образцом: есть ли у вас overview без цифр? сгруппированы ли данные?
- Перепишите свой текст, а не копируйте образец.
Ещё один образец на 8–9, процессы и карты подробнее и цикл работы с обратной связью — в гайде по Writing.
Частые вопросы
Можно ли выучить образцы ответов Task 1?
Учить их наизусть бесполезно: данные на экзамене будут другими. Образцы нужны, чтобы понять структуру, overview и язык сравнений.
Сколько абзацев в Task 1?
Обычно четыре: введение, overview и два абзаца деталей.
Следующий шаг
Пробный экзамен
Пробный экзамен IELTS
Listening, Reading, Writing и Speaking в формате компьютерного экзамена и прогноз балла IELTS по шкале 0–9.
350 ₽разово
Перейти к пробникуГайд
IELTS Writing на 7.5–8+: как пишут тексты высшего уровня
Writing — самая трудная часть экзамена для большинства. Здесь разобрано, за что на самом деле ставят 8 и почему «умные слова» не помогают.
500 ₽
Открыть гайд